After a few weeks hiatus, we’ll return this week to our Seventy at Seventy column where we’ve been looking at the price performance of 70 representative coins over the past 70 years, as reported by The Guidebook of U.S. Coins, better known as the "Red Book." This time, we’ll have a look at one of the most popular series in U.S. numismatics: Silver Dollars.
Silver Dollars have not always enjoyed the popularity they have today. During the early years of this study, most were worth under $10 in uncirculated condition. (This even includes the better dates such as the 1879-CC and 1928-P Peace Dollar.) Oddly, much of the increased interest in Silver Dollars came during the 1960s and 1970s, when enormous quantities were released onto the market by the government, coming out of the treasury vaults in sealed bags. Other than a few previously "rare" dates (1903-O and 1904-O), the huge influx of coins actually stimulated collector interest and prices rose steeply between 1957 and 1977.
Previous readers of this series are familiar with a weakness in this study – in that a substantial premium for the highest grade uncirculated and proof coins is a relatively recent phenomenon. Only since the late 1970s has a wide gap opened up between lower and higher grade uncirculated and proof coins. We have used the numerical grade MS-63 for the years 1987-2017, so consequently these results are skewed towards the lower end Uncirculated grades. The purchase of a gem quality coin (at only slightly more than an average specimen) anytime from the late 1940s through the late 1970s would have yielded far better returns.
Silver Dollar Table – Actual prices from A Guidebook of United States Coins
Date-MM |
Den |
Grade |
Note |
1947 |
1957 |
1967 |
1977 |
1987 |
1997 |
2007 |
2017 |
1879-CC |
$1 |
Unc (63) |
8 |
9 |
180 |
750 |
1,500 |
2,300 |
7,500 |
8,000 |
|
1881-S |
$1 |
Unc (63) |
3 |
3 |
3 |
11 |
100 |
28 |
50 |
65 |
|
1884-CC |
$1 |
Unc (63) |
4 |
7 |
38 |
30 |
170 |
65 |
260 |
240 |
|
1893-S |
$1 |
Unc (63) |
100 |
325 |
4,600 |
25,000 |
32,000 |
47,500 |
120,000 |
225,000 |
|
1895 |
$1 |
Prf (63) |
35 |
375 |
4,750 |
8,250 |
20,000 |
18,000 |
47,500 |
50,000 |
|
1921 |
$1 |
Unc (63) |
Peace |
2 |
9 |
14 |
150 |
400 |
225 |
450 |
450 |
1922 |
$1 |
Unc (63) |
2 |
3 |
2 |
10 |
65 |
20 |
32 |
40 |
|
1928 |
$1 |
Unc (63) |
3 |
9 |
115 |
185 |
450 |
250 |
750 |
850 |
|
TOTAL |
156 |
738 |
9,701 |
34,386 |
54,685 |
68,388 |
176,542 |
284,645 |
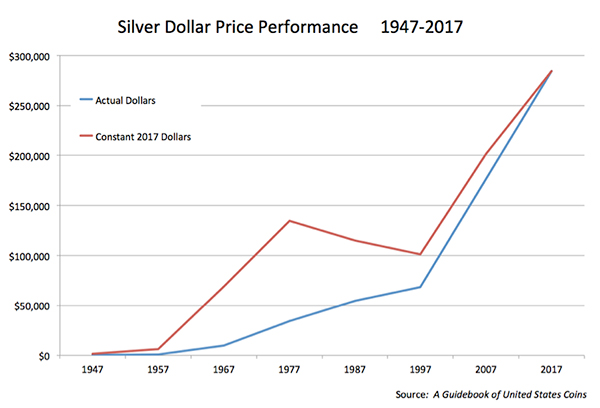
Three basic cycles are evident. The first is the explosive increase in values between 1947 and 1977, which saw prices increase by over 200 times. The next was a period of rather slow growth between 1977 and 1997 that only saw prices double in 20 years. Finally, we see another period of steeper growth from 1997 through today, where prices more than quadrupled. Overall, this basket of Silver Dollars returned an average of 11.3% per year, every year, for the past 70. Not too shabby.
Readers of past columns know that we like to examine the effects of inflation and the declining purchasing power of the dollar. Over short periods, this is not terribly relevant, but over a period of 70 years, it matters a great deal. The table below shows past prices, adjusted upward to constant 2017 dollars.
Gold Type Coin Table – Inflation-adjusted, constant 2017 dollars
Date-MM |
Den |
Grade |
Note |
1947 |
1957 |
1967 |
1977 |
1987 |
1997 |
2007 |
2017 |
1879-CC |
$1 |
Unc (63) |
80 |
72 |
1,275 |
2,950 |
3,150 |
3,400 |
8,550 |
8,000 |
|
1881-S |
$1 |
Unc (63) |
25 |
25 |
20 |
45 |
210 |
40 |
60 |
65 |
|
1884-CC |
$1 |
Unc (63) |
35 |
55 |
265 |
120 |
350 |
95 |
300 |
240 |
|
1893-S |
$1 |
Unc (63) |
1,050 |
2,750 |
32,500 |
97,750 |
67,000 |
70,500 |
137,000 |
225,000 |
|
1895 |
$1 |
Prf (63) |
375 |
3,150 |
33,750 |
32,250 |
42,000 |
26,500 |
54,000 |
50,000 |
|
1921 |
$1 |
Unc (63) |
Peace |
25 |
75 |
100 |
600 |
850 |
325 |
500 |
450 |
1922 |
$1 |
Unc (63) |
20 |
25 |
15 |
35 |
125 |
30 |
35 |
40 |
|
1928 |
$1 |
Unc (63) |
32 |
75 |
825 |
725 |
950 |
375 |
850 |
850 |
|
TOTAL |
1,642 |
6,227 |
68,750 |
56,280 |
134,475 |
114,365 |
101,265 |
284,645 |
Even after adjusting for the effects of inflation, a long-term investment in Silver Dollars provided a very handsome return of 7.65%. Now while that doesn’t sound like a tremendous amount for a single year, keep in mind that is a steady increase every year for the past 70, with no declines or pauses.
We should also note that while a good portion of the total is made up by the 1893-S, its large increase was typical of other rare date Morgans, and our use of the MS-63 price was a conservative approach. The current Guidebook lists an MS-65 at $650,000, and one could certainly have purchased one of that quality for a tiny premium over a lesser example in the early years of our study.
Next time we’ll have a look at some rare date gold coins.
Series Links:
http://www.pcgs.com/news/seventy-at-seventy-pt1-introduction
http://www.pcgs.com/news/seventy-at-seventy-pt2-circulated-early-type
http://www.pcgs.com/news/seventy-at-seventy-pt3-circulated-key-date
http://www.pcgs.com/news/seventy-at-seventy-pt4-19th-early-20th-century-type-key
http://www.pcgs.com/news/seventy-at-seventy-pt5-gold-type-coins
http://www.pcgs.com/news/seventy-at-seventy-pt6-silver-dollars


 Copper & Nickel
 Silver Coins
 Gold Coins
 Commemoratives
 Others
 Bullion
 World
 Coin Market
 Auctions
 Coin Collecting
 PCGS News