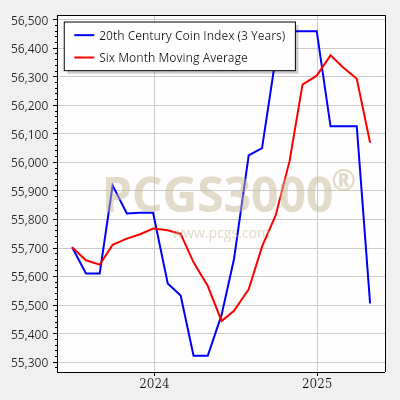
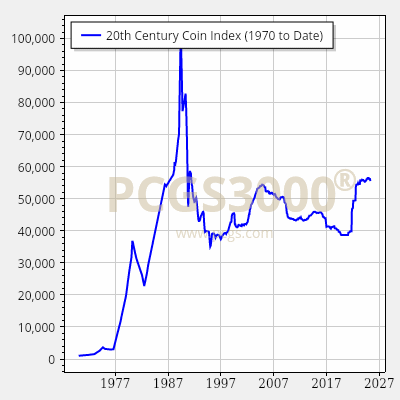
PCGS3000®
The PCGS3000® reflects the opinions of PCGS’s coin price experts with respect to indexes developed by PCGS for specific coin categories. Particular coins being offered for sale may not have been included within particular indexes, and if included, may not have experienced the same market movements as the index as a whole. Therefore, the PCGS3000® should only be used as one guide to rare coin prices and historical price movements, and not as the sole source for determining the value or market history of a particular coin. Collectors Universe, Inc. disclaims any warranties whatsoever with respect to the accuracy of the PCGS3000® or any specific coin index.
$73,102.05 (+2.65) 10-23 2:45 AM EST
We do our best to provide precise spot prices; however, during times of market volatility, prices may not be to-the-minute accurate.